AI powered
Dashboarding & Analytics
Pain Points
How It Works

Connecting Data Sources
Users connect their data sources to Superset by configuring the appropriate connectors. The platform supports a wide range of databases and big data engines, allowing for easy integration.
Building Queries and Visualizations
Through the SQL Lab section, users can write and execute SQL queries or use the visual query builder to explore their data. The results can be visualized using a variety of chart types and configurations available in Superset’s visualization library.

Creating Dashboards
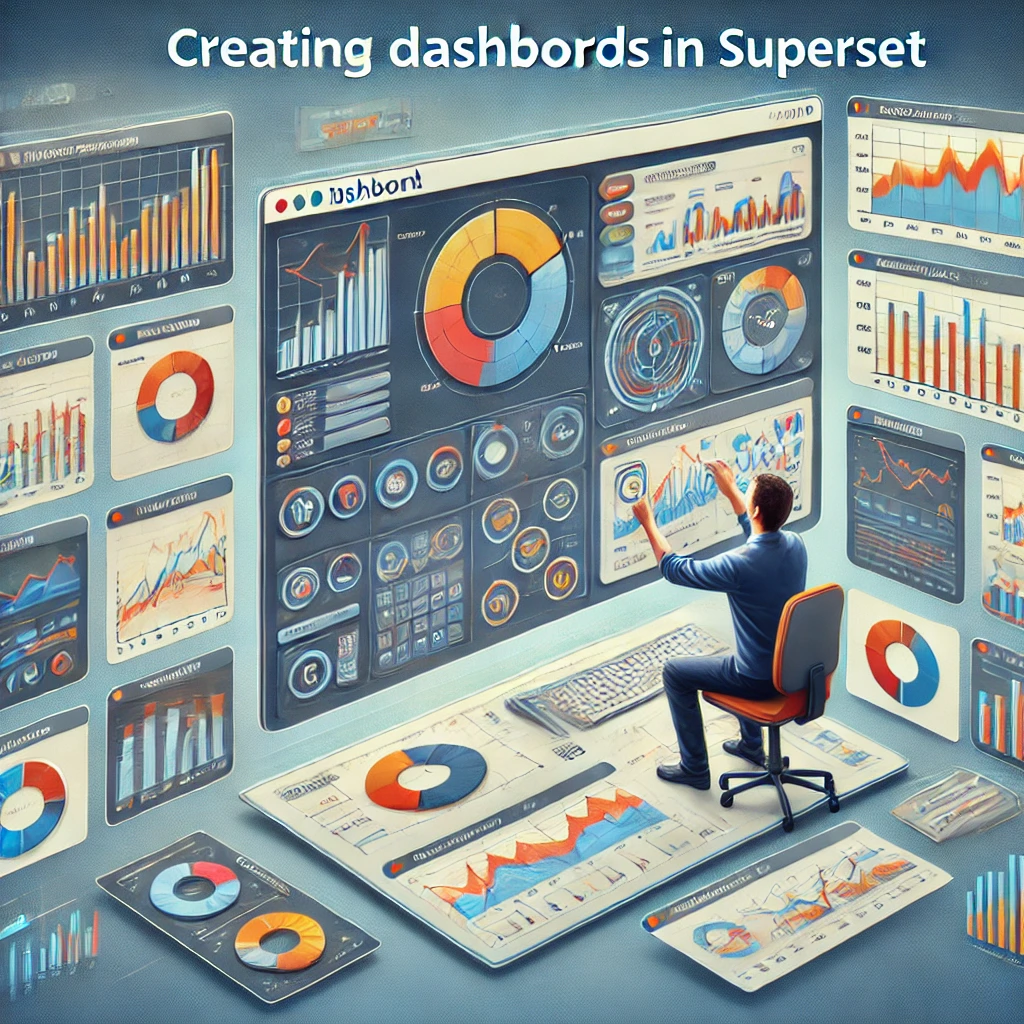
Users can drag and drop visualizations onto a dashboard canvas, arranging them in a layout that suits their needs. Superset’s dashboard builder allows for easy customization, including the addition of filters, parameters, and interactive elements.
Exploring and Sharing Dashboards
Once dashboards are created, they can be shared with other users or teams within the organization. Superset supports collaboration by allowing multiple users to work on the same dashboard and share insights easily.

Optimizing Performance
Superset’s built-in caching mechanism stores query results to improve dashboard performance. Users can configure caching settings based on their specific needs to balance performance and data freshness.
Managing Access and Security
Administrators can configure role-based access controls to ensure that users only have access to the data and dashboards relevant to their role. Superset’s integration with authentication systems ensures secure access and data protection.


